
What happened, from official sources
A front stalled over the Tennessee Valley for most of a week, and February 2019 became Nashville's wettest February, 13.47 inches through Feb. 27, ahead of 12.37 inches in 1880. NWS Nashville ranked it among the ten wettest months of any kind in the city's record.
Sources: NWS Nashville: Late February 2019 Historic Rainfall and Widespread Flooding
Key facts
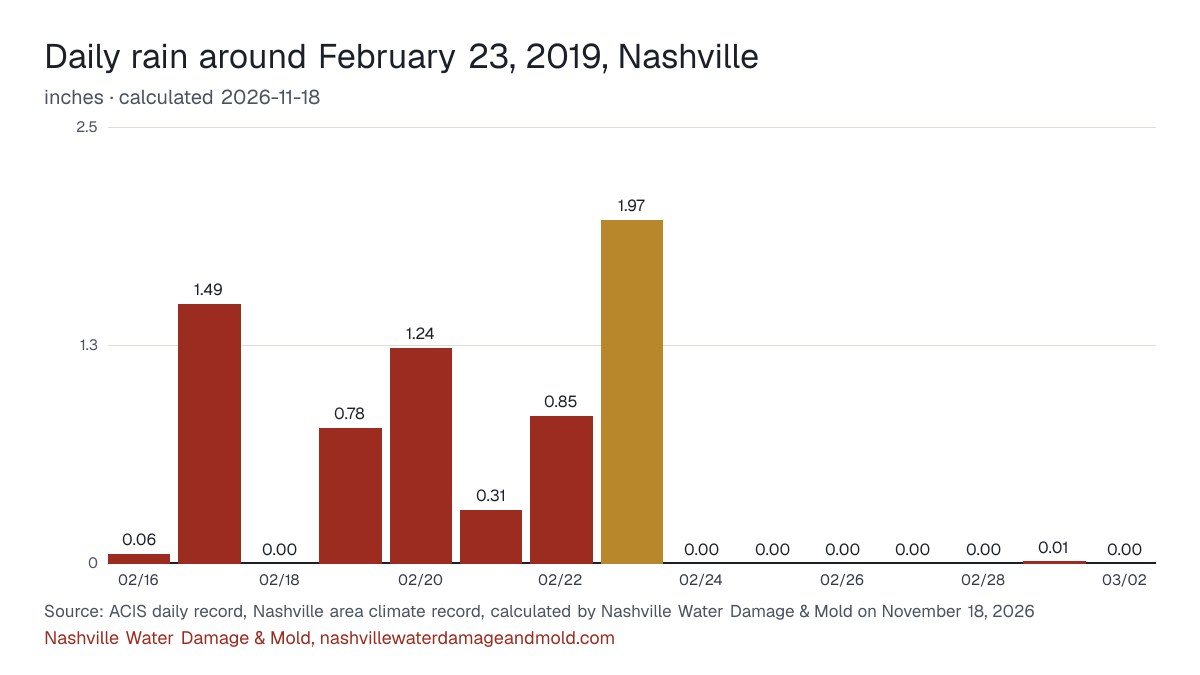
- Nashville's climate record shows 1.97 in. of rain on February 23, 2019 (calculated by Nashville Water Damage & Mold on November 18, 2026). ACIS daily record, Nashville area climate record
- That ranks 390th among all 56,810 days in the record since 1871, and 39th among the 4,378 February days on file (calculated by Nashville Water Damage & Mold on November 18, 2026). ACIS daily record, Nashville area climate record
- The day's rain equals 44% of a normal February's total of 4.47 in. (1991-2020 normals, calculated by Nashville Water Damage & Mold on November 18, 2026). ACIS daily record, Nashville area climate record
- With the day next to it, the two-day total was 2.82 in. (calculated by Nashville Water Damage & Mold on November 18, 2026). ACIS daily record, Nashville area climate record
Rain on the days around it
Nashville's daily rain from seven days before to seven days after February 23, 2019, with the report day picked out.
The numbers behind the chart
| Date | Rain | Low |
|---|---|---|
| February 16, 2019 | 0.06 in. | 33°F |
| February 17, 2019 | 1.49 in. | 40°F |
| February 18, 2019 | 0.00 in. | 32°F |
| February 19, 2019 | 0.78 in. | 31°F |
| February 20, 2019 | 1.24 in. | 43°F |
| February 21, 2019 | 0.31 in. | 41°F |
| February 22, 2019 | 0.85 in. | 45°F |
| February 23, 2019 | 1.97 in. | 51°F |
| February 24, 2019 | 0.00 in. | 39°F |
| February 25, 2019 | 0.00 in. | 33°F |
| February 26, 2019 | 0.00 in. | 31°F |
| February 27, 2019 | 0.00 in. | 36°F |
| February 28, 2019 | 0.00 in. | 41°F |
| March 1, 2019 | 0.01 in. | 40°F |
| March 2, 2019 | 0.00 in. | 40°F |
Mill Creek at Woodbine (Thompson Lane)
The highest reading at the Mill Creek at Woodbine (Thompson Lane) gauge in the days around February 23, 2019 was 10.32 ft, on February 23, 2019, below the National Weather Service's flood stage for this gauge. The flood stage there is 14 ft, moderate flooding starts at 17 ft and major at 21 ft.
| Date | Highest level |
|---|---|
| February 21, 2019 | 6.64 ft |
| February 22, 2019 | 8.09 ft |
| February 23, 2019 | 10.32 ft |
| February 24, 2019 | 7.87 ft |
| February 25, 2019 | 5.27 ft |
Source: U.S. Geological Survey, Mill Creek at Woodbine (Thompson Lane), 15-minute gage heights, highest reading each local day, calculated by Nashville Water Damage & Mold on November 14, 2026; flood stages from the National Weather Service's gauge page.
The five closest days in the record
| Date | Rain |
|---|---|
| December 31, 2018 | 1.97 in. |
| August 30, 2005 | 1.97 in. |
| January 6, 1995 | 1.97 in. |
| May 20, 1989 | 1.97 in. |
| May 23, 1987 | 1.97 in. |
Federal disaster declarations
No FEMA weather declaration naming Davidson County covers this date.
Source: FEMA OpenFEMA Disaster Declarations Summaries v2.
History, not a forecast: the ZIPs with the most flood claims
For context only, as history rather than a forecast: the three Nashville ZIPs on this site with the most NFIP flood claims across all years, not claims from this day.
- ZIP 37211: 682 claims on record
- ZIP 37215: 408 claims on record
- ZIP 37204: 403 claims on record
Source: FEMA OpenFEMA NFIP Redacted Claims v3, calculated by Nashville Water Damage & Mold on November 14, 2026. Each ZIP's numbers are on the Nashville flood risk by ZIP.
What to check at home after a day like this
- If a floor drain or a bottom-floor toilet starts to gurgle or back up during a downpour, stop using water. Metro Water Services takes sewer emergencies at 615-862-4600; ask for Emergency Service.
- Clear leaves off the storm drain at the curb and turn downspouts away from the foundation so water can't stand against the crawl space walls.
- A ceiling spot that darkens during a storm means water is sitting above it. Photograph it with the date and put a pan under any drip.
The printable emergency checklist and the flood cleanup in Nashville page have the full steps.
Sources: ACIS daily record for the Nashville area climate record (BNAthr), the National Weather Service's Nashville record, now kept at Nashville International Airport, with rain back to May 1871 and temperatures back to December 1873; NCEI 1991-2020 normals via ACIS; FEMA OpenFEMA. Method and the report rule: sources and methods.
Cite this page: “Nashville storm report: 1.97 in. of rain, February 23, 2019.” Nashville Water Damage & Mold, https://nashvillewaterdamageandmold.com/nashville-flooding-history/2019-02-23/. Updated November 18, 2026.